Our three approaches
Our ready-made funds are designed for growth, with the risk turned up or down according to taste.

Your investment options
Which one’s right for you depends on the ups and downs you’re happy with, and the longer you invest, the greater potential your money has to grow.
Learn about our investment mix


Higher potential returns and risk

Lower potential returns and risk
The investment mix shows you how much of your money typically goes into the higher risk investments with higher potential returns, and how much goes into the lower risk investments with lower potential returns.
For more info, check out our guide investing money and the risks.
Cautious
A lower-risk way to invest long term. Fewer ups and downs, but lower potential returns.
Investment mix

40%
Typically high risk
60%
Typically low risk
Balanced
The potential to grow your money with a few more ups and downs along the way.
Investment mix

70%
Typically high risk
30%
Typically low risk
Adventurous
Investment confident? This one’s got more ups and downs for higher potential returns.
Investment mix

90%
Typically high risk
10%
Typically low risk

These funds have some sustainability characteristics due to being responsibly invested. Sustainable investment labels help UK investors find funds that have a specific sustainability goal. These funds don’t have a UK sustainable investment label because they don’t have a specific sustainability goal.
The ups & downs
Investing is for the long term – usually at least 5 years.
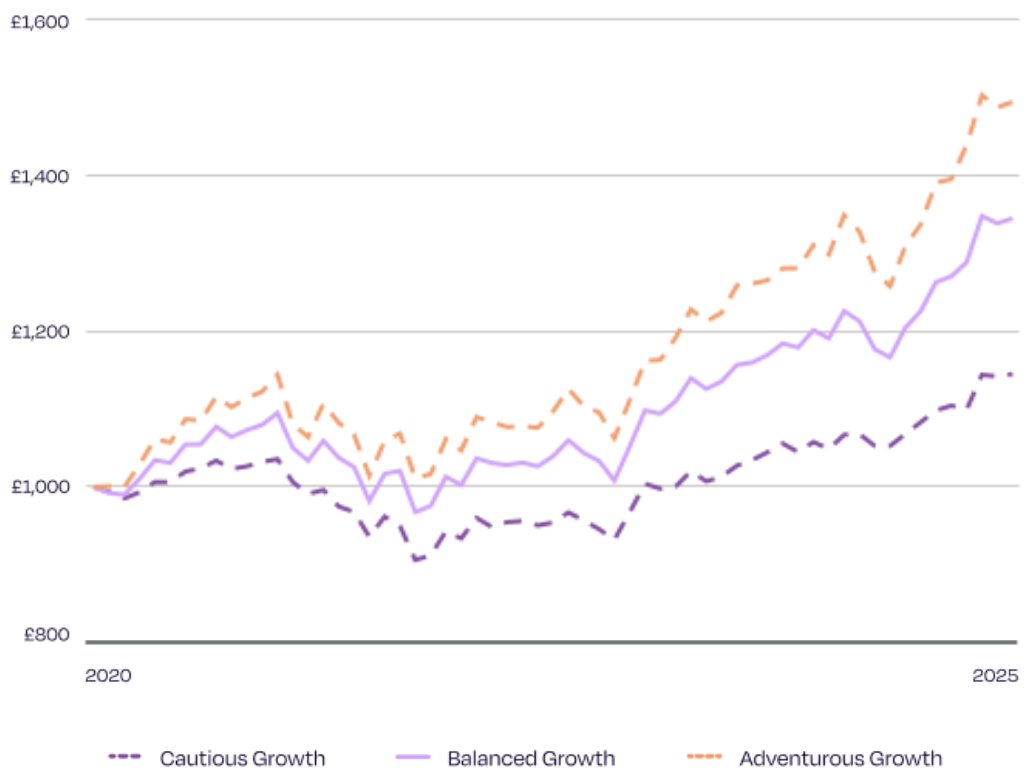
The lines on the graph show a 5-year return on £1,000 invested in our 3 growth approaches.
When it comes to investing, the past isn’t a reliable guide to the funds, and there’s always risk you might get back less that you put in.
Source data: Lipper, 31 December 2020 to 31 December 2025, bid to bid with net income invested.
Compare our funds – £1,000 invested over 5 years
More about this data
In the chart, we show performance over the last 5 years for each of our growth approaches, so you can see how they differ in terms of ups and downs. The Adventurous approach has bigger rises and falls than Balanced, and Balanced more than Cautious. This shows there is the potential for higher returns, but as the falls in value of the three growth approaches show, depending on markets and when you withdraw, there is the possibility of getting back less than you invested. Each of our funds have a stock-market related performance comparator. Returns over each of the last five years against each fund’s comparators are shown in the past performance table(s) below. The chart uses simulated performance for periods where the funds either were not in market or followed a different investment strategy. So, to help fund comparison, we’ve replicated the performance of the markets the funds invest in, to indicate what the performance may have been before its launch or change in strategy. The simulated return takes into account total annual charges of 0.45% and that the mix of assets are rebalanced once per month, but does not include the separate account fee of 0.30%.
Take a look at the past performance
The table below illustrates the annualised total returns of the fund for the period shown, compared with its benchmark. Remember, past performance isn’t a reliable guide to future performance.
The following is up-to-date as of 31 December 2025.
| December 2020 to December 2021 | December 2021 to December 2022 | December 2022 to December 2023 | December 2023 to December 2024 | December 2024 to December 2025 | |
|---|---|---|---|---|---|
| This fund | 3.6% | -9.7% | 7.5% | 4.4% | 9.2% |
| Performance Comparator* | 4.5% | -10.8% | 8.9% | 7.8% | 7.6% |
Source: Lipper, year on year, 31 December 2020 to 31 December 2025, bid to bid with net income reinvested.
Helping you compare this approach with our other funds
Cautious changed strategy in October 2021. To help you compare it with other funds we have replicated the performance of the markets the fund invests in, to indicate what the performance may have been prior to the strategy change. The simulated return takes into account the current annual charge of 0.45% and that the mix of assets are rebalanced once per month, but does not include the separate account fee of 0.30% per year.
Performance comparator explained
Cautious doesn’t use a benchmark as a guide for investing or as a target to beat. But we do use a performance comparator which investors may want to compare the fund’s performance against. This comprises 30% shares and 70% bonds. Shares are represented by the MSCI All Countries World Index GBP, whilst bonds are represented by the Bloomberg Global Aggregate Bond Index – GBP Hedged. The fund invests differently to the performance comparator therefore returns will always be different. For example there are differences in the way the fund is built vs. the comparator, along with the cost of investing, which is included for the fund return, but not the comparator. You cannot invest in the performance comparator.
The table below illustrates the annualised total returns of the fund for the period shown, compared with its benchmark. Remember, past performance isn’t a reliable guide to future performance.
The following is up-to-date as of 31 December 2025.
| December 2020 to December 2021 | December 2021 to December 2022 | December 2022 to December 2023 | December 2023 to December 2024 | December 2024 to December 2025 | |
|---|---|---|---|---|---|
| This fund | 9.5% | -8.3% | 9.5% | 8.4% | 12.9% |
| Performance Comparator* | 10.8% | -9.6% | 11.6% | 12.8% | 10.4% |
Source: Lipper, year on year, 31 December 2020 to 31 December 2025, bid to bid with net income reinvested.
Helping you compare this approach with our other funds
Balanced changed strategy in October 2021. To help you compare it with other funds we have replicated the performance of the markets the fund invests in, to indicate what the performance may have been prior to the strategy change. The simulated return takes into account the current annual charge of 0.45% and that the mix of assets are rebalanced once per month, but does not include the separate account fee of 0.30% per year.
Performance comparator explained
Balanced doesn’t use a benchmark as a guide for investing or as a target to beat. But we do use a performance comparator which investors may want to compare the fund’s performance against. This comprises 60% shares and 40% bonds. Shares are represented by the MSCI All Countries World Index GBP, whilst bonds are represented by the Bloomberg Global Aggregate Bond Index – GBP Hedged. The fund invests differently to the performance comparator therefore returns will always be different. For example there are differences in the way the fund is built vs. the comparator, along with the cost of investing, which is included for the fund return, but not the comparator. You cannot invest in the performance comparator.
The table below illustrates the annualised total returns of the fund for the period shown, compared with its benchmark. Remember, past performance isn’t a reliable guide to future performance.
Here’s the detail at 31 December 2025
| December 2020 to December 2021 | December 2021 to December 2022 | December 2022 to December 2023 | December 2023 to December 2024 | December 2024 to December 2025 | |
|---|---|---|---|---|---|
| This fund | 14.8% | -8.4% | 11.0% | 11.7% | 15.0% |
| Performance Comparator* | 15.1% | -8.8% | 13.5% | 16.2% | 12.2% |
Source: Lipper, year on year, 31 December 2020 to 31 December 2025, bid to bid with net income reinvested.
Helping you compare this approach with our other funds
Adventurous launched in November 2020. To help you compare it with other funds we have replicated the performance of the markets the fund invests in, to indicate what the performance may have been prior to its launch. The simulated return takes into account total annual charges of 0.45% and that the mix of assets are rebalanced once per month, but does not include the separate account fee of 0.30% per year.
Performance comparator explained
Adventurous doesn’t use a benchmark as a guide for investing or as a target to beat. But we do use a performance comparator which investors may want to compare the fund’s performance against. This comprises 80% shares and 20% bonds. Shares are represented by the MSCI All Countries World Index GBP, whilst bonds are represented by the Bloomberg Global Aggregate Bond Index – GBP Hedged. The fund invests differently to the performance comparator therefore returns will always be different. For example there are differences in the way the fund is built vs. the comparator, along with the cost of investing, which is included for the fund return, but not the comparator. You cannot invest in the performance comparator.

Remember, the value of investments can go up and down, so you may get back less money than you put in. Tax depends on your individual circumstances and the regulations may change in the future.
How your money’s invested
Whichever investment choice is right for you, our overall approach is the same. Here’s how our experts look to grow your money:
- Investing in a fund of funds
Your money’s pooled together with other Octopus Money customers and invested in a fund made of other funds. Everyone’s money is spread around, so everyone’s risk is reduced.
- Mixing it up
Changing the fund’s mix of shares, bonds and other investments changes how much your money goes up and down over time, and helps us keep the overall risk level at an acceptable level.
- Going global
Investing worldwide spreads the risk and opens up more opportunities to grow your money.
See how we invest in various companies, industries and regions for maximum growth with minimal harm.
Our charges
Our charges are 0.75% in total each year, based on the value of your account. This is made up of two clear and simple charges.
- An Account Charge of 0.30% for managing your account
- A Management Charge of 0.45% to manage your investments

Let’s get started
We’re ready when you are. Pick an option and let’s go.